Know {for sure} how to Improve your website with My Favorite Free Tool
Whenever I start work on a website, I start with HotJar.
It’s easy to install and will give you plenty of data on the free plan.
Basically, it’s a little bit of code that you plug into your site. Hopefully I didn’t lose you when I mentioned code. I pinky-promise it’s easy.
HotJar will [anonymously] track your visitors’ activity and generate a heatmap over your website… it looks kind of like a weather radar.
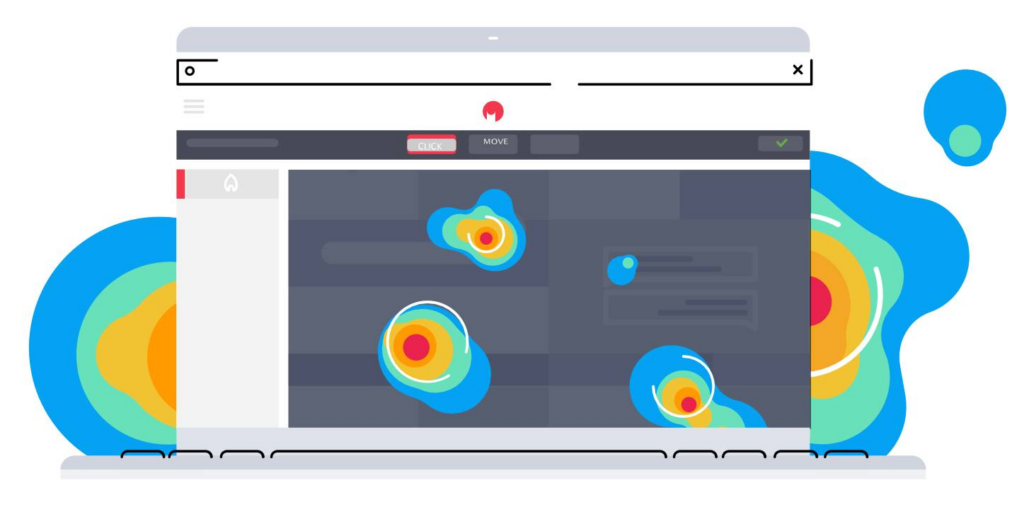
It helps you gather concrete, visual information: Where do people scroll? Where do people click? What are they ignoring?
The answers give us really clear action steps for improving our sites.
EXAMPLE:
Let’s say you have a big button near the top of your homepage that says “Meet our Teachers.”
After a few weeks of tracking, the heatmap shows you that button is HOT – it’s BRIGHT RED – it’s getting tons of clicks.
The PROBLEM is that you really want them to click the button that’s farther down on the page: “Schedule a Tour” – but it looks like they aren’t making it that far. It’s barely green – that button gets very few clicks.
Well, now with this data, you can make some changes.
Maybe you move the Schedule a Tour button on your homepage.
Maybe you add a Schedule a Tour button to the Meet the Teachers page.
This is just one tiny example. All sorts of fun insights come out of looking at HotJar results. You can totally nerd out on it (speaking for myself).
